Stop Trusting CloudWatch to Monitor Your Dead Letter Queues
March 29, 2026 · DeadQueue Team
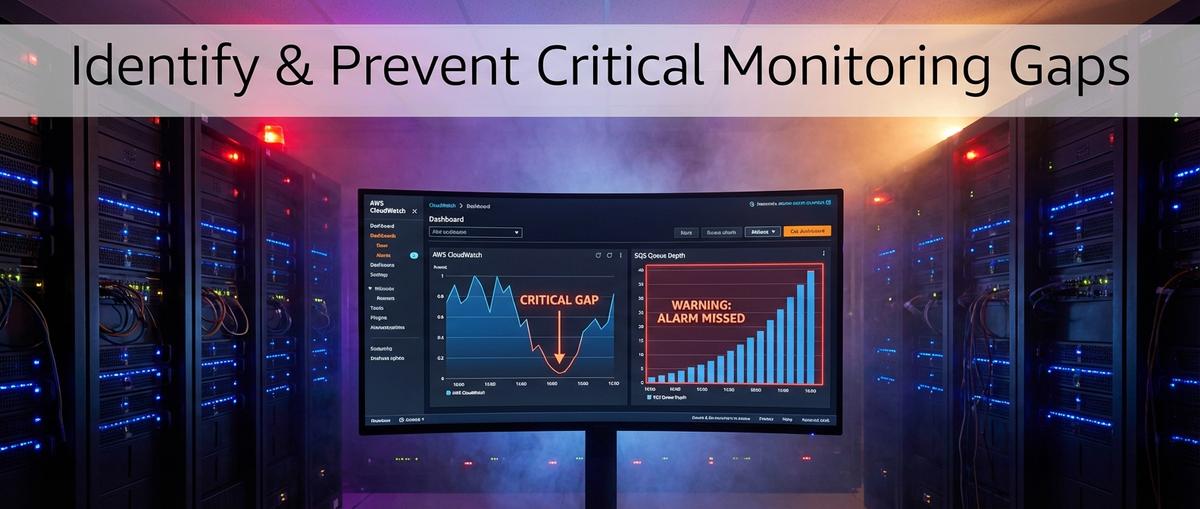
Your CloudWatch alarm fired at 500 messages. But the queue hit 500 yesterday too. And the day before. You just never noticed because it drained in time.
CloudWatch gives you numbers. It does not give you context, trends, or the specific failure mode that actually kills on-call engineers: the slow drain that looks fine right up until your messages expire. You get a number. You set a threshold. And somewhere between those two things, a whole category of DLQ failures slips right through.
Here are the five gaps that let it happen.
Why Engineers Trust CloudWatch (And Why That Trust Is Misplaced)
CloudWatch is genuinely good at what it does. For EC2, RDS, load balancers, and most AWS services, the standard pattern works: pick a metric, set a threshold, wire up an SNS topic, done. The model fits because those services produce metrics that mean roughly the same thing over time.
SQS is different. The metrics are approximate. Queue behavior is asynchronous. Failure modes play out over hours, not seconds. And the thing that actually matters, whether your messages are going to expire before anyone reads them, is not something CloudWatch can tell you directly.
Most teams alarm on ApproximateNumberOfMessagesVisible with a threshold somewhere around 100 or 500. That catches the easy case: a consumer dies, messages pile up fast, alarm fires, someone gets paged. It works for sudden failures.
It does not work for the slow ones. And in practice, slow failures are the ones that wake you up at 3am to find a queue that has been quietly accumulating failures for six hours while every metric looked “normal.”
The problem is not CloudWatch. The problem is that SQS failure modes do not fit point-in-time metric thresholds. What you need is trend awareness, age tracking, and context. What you get is a number compared to a line.
Gap 1: Depth-Only Alarms Miss Slow Drains
A threshold alarm fires when you cross the line. It has no opinion about how long you have been near the line, or whether you are trending toward it.
Picture this: your DLQ sits at 80 messages. Your alarm threshold is 100. Over six hours, your Lambda consumer processes some messages but keeps failing on a subset. The depth bounces between 60 and 90. Never crosses 100. The alarm never fires.
Meanwhile, those 80 messages were sent 72 hours ago. Your queue retention is 96 hours. They have 24 hours left. Nobody knows.
This is the slow drain. The queue is not empty. It is not growing fast enough to trigger your alarm. But messages are bleeding toward expiration, and when they hit the retention limit, they vanish. No error. No alert. Just data loss.
CloudWatch has no built-in alarm type for “this queue has had messages in it for more than N hours.” You can approximate it with a metric math alarm that computes rate of change, but it requires setting up multiple alarms across multiple data points, with careful configuration to avoid false positives on normal traffic patterns. Most teams do not do this. The default setup just watches the number.
The fix requires either rate-of-change monitoring or age-based signals. CloudWatch can technically produce both if you invest the effort. But it does not do it out of the box, and the documentation path from “I want to know if messages are stale” to “here is a working alarm” is not short.
Gap 2: ApproximateNumberOfMessagesSent Is the Wrong Metric
This one is worth stopping on, because a lot of teams have an alarm on this metric right now and believe it covers them.
ApproximateNumberOfMessagesSent counts messages that were explicitly sent to the queue by a producer. That means your application called SendMessage or SendMessageBatch and targeted the DLQ directly.
That is not how most messages end up in a DLQ.
When a Lambda function fails to process a message and hits maxReceiveCount, SQS moves the message to the DLQ automatically. This is the normal failure path. It does not call SendMessage. It does not increment ApproximateNumberOfMessagesSent. The metric stays at zero.
So if your alarm watches ApproximateNumberOfMessagesSent on your DLQ, it will read zero while that queue fills with auto-redriven failures from your Lambda consumer. The alarm never fires. The queue fills. You find out when someone notices missing data or a downstream service starts behaving strangely.
The correct metric is ApproximateNumberOfMessagesVisible on the DLQ itself. That reflects the actual number of messages sitting in the queue regardless of how they got there.
If you have existing CloudWatch alarms on your DLQs, go check right now which metric they are watching. This misconfiguration is common enough that it is worth verifying. Open the CloudWatch console, find your DLQ alarms, and confirm the metric is ApproximateNumberOfMessagesVisible and the queue name in the dimensions is your DLQ, not your source queue.
This also means any dashboard that shows ApproximateNumberOfMessagesSent on a DLQ as a proxy for “how many failures are happening” is showing you incomplete data. Lambda-triggered failures, Step Functions failures, and any other auto-redrive path are invisible to that metric.
For more on how Lambda retry behavior fills DLQs in ways that catch teams off guard, see Lambda Retry Storms and DLQ Fill.
Gap 3: No Native Age-Based Alerting
ApproximateAgeOfOldestMessage exists. It is a real CloudWatch metric. But it applies to the source queue, reflecting how long the oldest message has been waiting for a consumer to pick it up.
For DLQ monitoring, that is the wrong queue and the wrong question.
What you want to know for a DLQ is: how old are the messages in the dead letter queue itself, and how much time do they have left before they expire? Those are different things. A message in the DLQ has already failed processing. It is not waiting to be consumed in the normal sense. It is waiting to be investigated and either redriven or discarded. The clock that matters is the retention clock.
Here is the gap: SQS does not expose per-DLQ age in a form that CloudWatch can easily alarm on. The retention timer for a message in the DLQ started when the message was first sent to the source queue. If your source queue retention and DLQ retention are both set to four days, and a message spent two days in the source queue before failing into the DLQ, it has two days left. CloudWatch does not surface this directly.
Message age matters more than depth. Ten messages that are three days old, with a four-day retention window, are a more urgent problem than 200 messages from an hour ago. One of those scenarios is an active incident. The other is business as usual that you will catch in the next hour.
CloudWatch gives you the number. It does not give you the urgency.
Default SQS retention is four days. Four days feels like a lot of time until you realize that a message can spend most of that time in the source queue before failing. By the time it lands in the DLQ, your real window to investigate might be hours, not days.
Gap 4: Alerts With No Context Are Just Noise
A CloudWatch alarm notification, by default, tells you: the metric name, the threshold you set, the current value, and your AWS account ID.
That is it.
What it does not tell you: which service owns this queue, what the likely root cause is, where the runbook lives, or what the queue is supposed to process. At 2am, “ApproximateNumberOfMessagesVisible > 100 for queue-name-prod-dlq” gives an on-call engineer exactly one piece of information: something is in the DLQ.
Most teams work around this by embedding runbook links in SNS topic descriptions or adding context to the alarm description field. That works until you add a new queue and forget to update the alarm config, or until the runbook moves and the link is stale, or until the engineer getting paged is not the one who originally set up the alarm.
Alert fatigue compounds this. When every alarm looks the same and contains no actionable context, engineers learn to acknowledge and investigate manually every time. That takes time. It also conditions people to treat alarms as the start of a scavenger hunt rather than a signal with a clear next step.
The engineers who respond fastest to incidents are the ones whose alerts tell them what broke, how bad it is, and where to look. Generic threshold alarms do not do that. They tell you a number crossed a line. Everything else is on you to figure out.
For a deeper look at what gets missed when DLQ alerts lack context, see DLQ Incident Response Blind Spots.
Gap 5: No Retention Mismatch Detection
Source queues and DLQs have independent retention settings. You configure them separately. Nothing in AWS warns you if they are misconfigured relative to each other.
The most common misconfiguration: both set to four days. It sounds reasonable. It is not.
When a message fails and moves to the DLQ, its retention timer does not reset. The timer started when the message was first sent to the source queue. If the message spent 12 hours being retried before hitting maxReceiveCount, it arrives in the DLQ with 3.5 days of retention remaining. That sounds fine.
But the real problem is the equal-retention case. If your source queue retention is four days and your DLQ retention is also four days, a message that takes a full four days to exhaust its retries (slow retry interval, high maxReceiveCount) arrives in the DLQ with almost no time left. It can expire before anyone opens an investigation.
AWS documentation recommends setting DLQ retention longer than source queue retention specifically to avoid this. A reasonable setup: source queue at four days, DLQ at 14 days. That gives you time to actually look at failed messages before they vanish.
No CloudWatch alarm type can detect “DLQ retention is less than or equal to source queue retention.” It is not a metric. It is a configuration state. CloudWatch does not audit your queue configurations. It just watches metrics.
This means the misconfiguration can sit there, undetected, until you have an incident where messages expire out of the DLQ before the investigation is complete. At that point, the data is gone. CloudWatch will not tell you that the configuration caused it.
For a practical runbook for DLQ investigations, including retention checks, see SQS DLQ Runbook for On-Call Engineers.
What You Actually Need From DLQ Monitoring
The pattern that actually works looks like this:
Trend-aware depth monitoring. Not just “is depth above X” but “has depth been non-zero for more than N hours” and “is depth growing faster than it is draining.” Point-in-time thresholds miss slow failures entirely.
Age-based alerting that fires before retention windows close. The signal you want is “this message has been in the DLQ for 80% of its remaining retention time.” That fires when there is still time to act, not after the data is gone.
Alerts that include queue name, message age, depth, and a direct runbook link. An on-call engineer should be able to read the alert and know exactly what queue failed, how urgent it is, and where to start investigating. Not a metric name and an account ID.
Automatic retention mismatch detection. If your DLQ retention is shorter than or equal to your source queue retention, you need to know before it causes data loss. This is a configuration check, not a metric alarm.
Coverage of auto-redriven messages. Any monitoring system that relies on ApproximateNumberOfMessagesSent is blind to the most common failure path. You need visibility into ApproximateNumberOfMessagesVisible on the DLQ itself, tracked over time.
CloudWatch can approximate some of this with significant configuration effort: metric math alarms, custom metrics pushed from Lambda, manual runbook links in SNS. It is possible. It is also the kind of thing that drifts out of date as your architecture changes, requires ongoing maintenance, and still does not solve retention mismatch detection.
That is the gap DeadQueue was built to close.
DeadQueue monitors SQS dead letter queues for depth, message age, and slow drains, and alerts via Slack, email, or PagerDuty with queue name, depth, age, and a direct runbook link. It catches auto-redriven messages that CloudWatch misses and flags retention mismatches before they become incidents. Free tier covers 3 queues. Connect your AWS account and get your first alert in under 5 minutes at https://www.deadqueue.com.