DLQ Incident Response Blind Spots: Why On-Call Engineers Miss Silent Failures
March 24, 2026 · DeadQueue Team
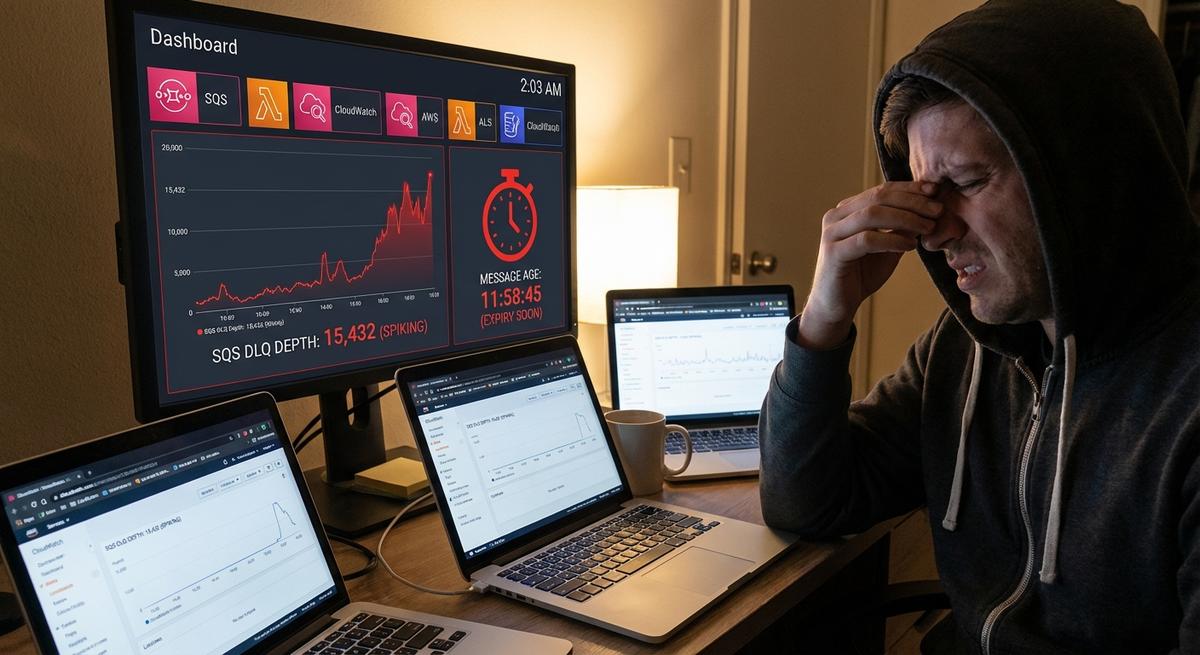
You get paged at 2 AM. The alert says prod is down. You grab coffee and log in. Metrics look normal. No errors in the logs. Customers are yelling on support channels. Orders aren’t going through. You start digging. CloudWatch. Lambda logs. SQS console. Tabs multiply. After 45 minutes, you spot it. The DLQ has 800 messages. The oldest sat there for 18 hours. MTTR is toast. This is your third time this month.
What r/sre Engineers Live Through
Go look at r/sre right now. You’ll see the same stories. One post from two days ago: “DLQ filled up overnight. No alert fired. Lambda retries hit max. We lost $15k in orders before anyone noticed.” The comments explode. People share their pain. “CloudWatch doesn’t track message age in DLQs.” “Logs are spread across three regions.” “Hunting in the console takes 25 minutes minimum.”
Another thread: “On-call nightmare: DLQ growing but no visibility across tools.” It has 80 upvotes. Replies name the issues. PagerDuty alerts on high CPU or memory. Never on queue depth. Splunk grabs Lambda traces but ignores the DLQ. New Relic monitors app metrics. Misses message age completely. The on-call engineer flips between dashboards. Time wasted. MTTR jumps from 7 minutes to 50. That’s the norm.
Here’s a brutal one. “Junior on rotation misses DLQ entirely. Thinks Lambda is fine because invocations look good. Customers flood support. Ticket escalates.” Silent DLQ failures erode trust. One miss hurts. Two in a row? People quit or get fired.
Someone else posted: “Multi-queue setup. DLQ per Lambda. No central view. Spent an hour clicking queues.” Others chime in. “Datadog agent doesn’t poll DLQs by default.” “Grafana queries CloudWatch but lags 5 minutes.” “Opsgenie rules too basic for age thresholds.”
The big takeaway? Tools don’t connect. Logs here. Metrics there. Console somewhere else. On-call fights the stack instead of the bug. Silent failures win until money vanishes.
SQS Tricks That Fool Even Veterans
SQS DLQs seem simple. Point the source queue’s redrive policy at a DLQ. Failed messages land there. Watch ApproximateNumberOfMessagesVisible in CloudWatch. Set an alarm. Done.
Not quite. CloudWatch has holes. ApproxNumberOfMessagesVisible sums everything: fresh arrivals and ancient backlog. A quick burst hits 200. Consumer drains it. Metric drops. But what if the consumer breaks? Messages pile up. Age grows. Expiry kicks in at 1-day default. Data lost. Metric never crossed your depth threshold. No page.
Expiry carryover is sneaky. DLQ max retention is 14 days. Often set shorter, like 4 days. Messages expire from DLQ. But if your source queue visibility timeout is misconfigured or your Lambda timeout is too short, failures bounce back fast. The cycle repeats. DLQ empties on expiry. Metric reads zero. Problem hides.
Other lies:
NumberOfMessagesReceivedcounts every arrival, not current depthAgeOfOldestMessageonly works on main queues, not DLQs natively- You need to force a
ReceiveMessagecall, peekSentTimestamp, then do the math yourself
Multi-account setups are worse. DLQs cross-account. Permissions slip. CloudWatch lags. Console search fails. Poison pill messages choke Lambda forever, retry to DLQ, and if the DLQ consumer is offline for maintenance — age climbs with zero alert.
Solution: Alert on Depth AND Age
Fix it right. Page when DLQ depth > 0 AND oldest message age exceeds your threshold. Two hours works for most teams. Bursts self-clear. Stuck ones page you.
Build with Lambda. Poll every 5 minutes via EventBridge. Use boto3 to check depth, peek a message, calculate age from SentTimestamp, and alert if the threshold is breached.
import boto3
import time
import json
import urllib3

sqs = boto3.client('sqs')
http = urllib3.PoolManager()

DLQ_URLS = [
    'https://sqs.us-east-1.amazonaws.com/123456789012/order-dlq',
]

SLACK_WEBHOOK = 'https://hooks.slack.com/services/...'

def lambda_handler(event, context):
    for dlq_url in DLQ_URLS:
        attrs = sqs.get_queue_attributes(
            QueueUrl=dlq_url,
            AttributeNames=['ApproximateNumberOfMessages']
        )
        depth = int(attrs['Attributes']['ApproximateNumberOfMessages'])
        if depth == 0:
            continue

        resp = sqs.receive_message(
            QueueUrl=dlq_url,
            MaxNumberOfMessages=1,
            WaitTimeSeconds=0,
            VisibilityTimeout=30
        )
        if 'Messages' in resp:
            msg = resp['Messages'][0]
            age_ms = time.time() * 1000 - int(msg['Attributes']['SentTimestamp'])
            age_hours = age_ms / 3600000
            if age_hours > 2:
                alert = {
                    'text': f"🚨 DLQ Alert: {dlq_url}\nDepth: {depth}\nOldest age: {age_hours:.1f} hours",
                    'username': 'DeadQueue Bot'
                }
                http.request('POST', SLACK_WEBHOOK, body=json.dumps(alert))
    return {'statusCode': 200}
Required permissions: SQS read on DLQs, CloudWatch Logs write, EventBridge rule cron(*/5 * * * ? *). Cost runs about $0.01/day per queue. Tune thresholds to your domain: ecommerce usually 1 hour, IoT 30 minutes.
DeadQueue Handles This Without the Boilerplate
Maintaining custom pollers across a dozen queues gets old fast. DeadQueue was built to replace exactly this pattern.
Point it at your queues in a YAML config. It monitors depth, message age, and trends. Alerts go to Slack, Discord, PagerDuty, or email. Multi-account support via IAM roles.
queues:
  order-dlq:
    region: us-east-1
    account: '123456789012'
    alert_depth: 5
    alert_age: 2h
    webhook: https://hooks.slack.com/services/your/webhook
  payment-dlq:
    region: us-west-2
    alert_age: 1h
    pd_integration: true
Run it with docker run -v config.yaml:/app/config.yaml venerite/deadqueue. You get a live dashboard, Grafana export, 30-day history, and alerts that fire on the combination of depth and age that your CloudWatch alarms miss entirely.
When a DLQ hits depth 15 with oldest message age 2h 20m, you get a Slack ping with the queue name, depth, age, and a direct link to the DeadQueue view. No console hunting. MTTR drops fast.
End the Cycle
Silent DLQs wreck on-call. Scattered tools waste time. SQS metrics mislead. Depth plus age alerts are the fix. DeadQueue automates it across every queue you own.
Get DeadQueue free on GitHub. Docker image and docs included. SQS support today, Kafka coming soon.
Your next page doesn’t have to be a 45-minute mystery.