SQS Dead Letter Queue Alert: The First 5 Checks to Run
March 26, 2026 · DeadQueue Team
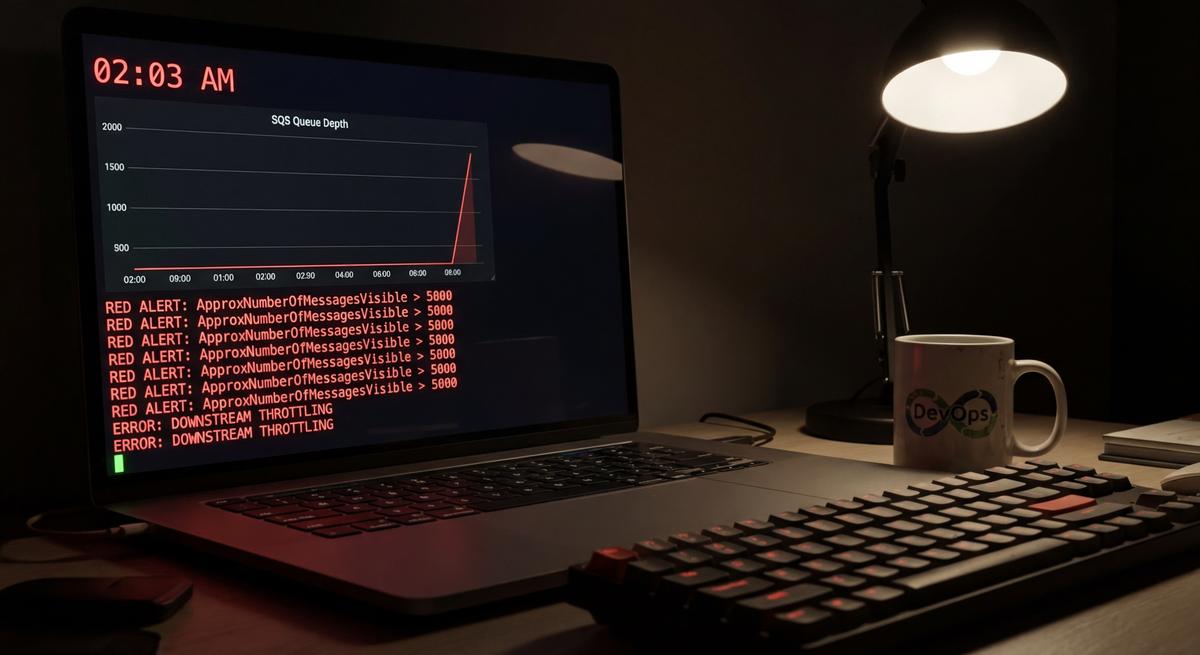
Your phone goes off at 2am. DLQ depth alert. You open the AWS console, stare at a queue with 847 messages, and realize you have no idea where to start.
This happens to every team eventually. Not because the engineers are bad, but because no one ever wrote down the playbook.
Why DLQ Incidents Always Start From Scratch
Ask five engineers on the same team how they’d diagnose a DLQ alert. You’ll get five different answers. One opens CloudWatch. Another SSHes into a consumer EC2 instance to tail logs. A third starts replaying messages immediately, which is usually the wrong first move. Someone else files a ticket and waits for the on-call rotation to catch it.
None of them are doing it the same way, and none of them are doing it fast.
The reason is straightforward: DLQ diagnosis is tribal knowledge. It lives in the head of whoever built the queue, or whoever got paged the last time this happened. When that person changes teams or leaves the company, the knowledge goes with them. The next engineer gets paged cold, with no context and no runbook.
That delay has a real cost. SQS messages have a maximum retention period of 14 days, but most production queues are configured shorter than that. Some are set to 4 days, some to 1. Once a message expires, it’s gone. No replay, no recovery, no second chance.
DLQs are often the last visible signal before data is quietly, permanently lost. By the time an alert fires, messages may have been failing for hours. If the team spends another hour just figuring out where to look, the window to recover gets narrower.
The fix is a runbook. Not a wiki page no one reads. An actual step-by-step document, short enough to follow at 2am, specific enough to be useful.
Here’s what that runbook should cover.
The First 5 Minutes: Questions Before Commands
Resist the urge to start clicking things. The first five minutes should be questions, not commands. The answers tell you where to look.
How many messages are in the DLQ right now, and is it still growing?
Pull ApproximateNumberOfMessages from the SQS console or CloudWatch. Check whether it went up in the last 5 minutes. A static depth means the bleeding may have stopped. A still-growing depth means the root cause is still active.
aws sqs get-queue-attributes \
  --queue-url https://sqs.us-east-1.amazonaws.com/123456789/your-dlq \
  --attribute-names ApproximateNumberOfMessages
When did the first message land in the DLQ?
This is not the same as when the alert fired. Alerts often have a delay, and some teams configure them with a 15-minute or even 30-minute evaluation window. The actual incident may have started much earlier.
Check the DLQ’s ApproximateAgeOfOldestMessage metric. If the oldest message is 3 hours old but the alert fired 20 minutes ago, you have a 3-hour window to look at in your logs.
What is the source queue’s approximate age of oldest message?
If the source queue is also backing up, that’s a different problem than just a failing consumer. It means messages are not even reaching the consumer, or the consumer is so far behind that the DLQ is filling because messages are being retried past their max receive count.
Has anything changed in the last 2 hours?
This one resolves probably 40% of incidents before you even touch a log. Ask: was there a deploy? A config push? A Lambda function update? Did an upstream dependency have an incident? Did someone change the queue’s visibility timeout or max receive count?
Check your deployment tool, your config management system, and your team’s Slack channel. Changes and DLQ spikes correlate more often than most teams expect.
The Three Root Causes (And How to Tell Them Apart)
Most DLQ incidents trace back to one of three things: a code bug, an infrastructure failure, or a throttle or capacity issue. The triage steps are different for each, and getting this wrong wastes time.
Code Bug
A code bug tends to follow a consistent failure pattern. The same message type fails repeatedly. A different message type, say a different event schema or a different order type, may process fine. The consumer logs show errors pointing to parsing, validation, or business logic, not networking.
Common signs:
- Error message contains
NullPointerException,KeyError,JSON parse error, or similar - Stack trace points into your application code, not into an AWS SDK call
- The failures started exactly when a deploy happened
- Replaying the message produces the exact same error every time
If you see this pattern, do not replay messages. The fix is a code change. Replaying will just refill the DLQ with the same failures. Deploy a fix first, then replay.
Infrastructure Failure
An infrastructure failure looks sudden and affects multiple message types at once. It’s not selective. The consumer logs show timeouts, connection refused errors, or HTTP 5xx responses from a downstream dependency. The consumer itself may be up, but the thing it needs (a database, an external API, another service) is not responding.
Common signs:
- Multiple different message types started failing at the same time
- Consumer logs show
connection refused,timeout, or502/503from a downstream service - The failure started without any recent deploy
- Checking the downstream service shows it’s down or degraded
In this case, the fix lives outside your queue. You need to restore the downstream dependency first. Once it’s back, messages can be replayed safely, assuming your consumer is idempotent.
Throttle or Capacity Issue
A throttle issue has a gradual onset, not a sudden one. It creeps in. Consumer logs show 429 responses from the downstream service you’re calling. Lambda concurrency metrics, if you’re using Lambda consumers, show a spike toward the concurrency limit. The DLQ depth climbs slowly rather than jumping all at once.
Common signs:
- Consumer logs show 429s or
ThrottlingExceptionfrom DynamoDB, an external API, or another AWS service - Lambda reserved or unreserved concurrency is maxed out
- The DLQ started filling gradually over 20 to 60 minutes, not all at once
- Message processing was working fine earlier in the day but degraded under load
The fix depends on what’s throttling. If it’s your Lambda hitting concurrency limits, you may need to raise the limit or implement a backoff strategy. If it’s a downstream API, you may need to reduce concurrency or implement rate limiting in the consumer.
What CloudWatch Won’t Tell You (And What to Check Instead)
CloudWatch is the default tool for SQS monitoring, and it’s fine, but it has several gaps that catch teams off guard.
NumberOfMessagesSent does not increment on auto-redrive.
If you’re using SQS’s auto-redrive feature (available for queues with a DLQ configured), messages moved back from the DLQ to the source queue do not show up in NumberOfMessagesSent. This makes it look like no messages are moving when they are. Check NumberOfMessagesReceived on the source queue after a redrive to confirm messages are flowing.
ApproximateNumberOfMessagesNotVisible hides in-flight messages.
When a consumer picks up a message, it becomes invisible to other consumers during the visibility timeout period. Those messages don’t show in ApproximateNumberOfMessages. If you’re looking at queue depth to assess how backed up things are, you need to add ApproximateNumberOfMessagesNotVisible to get the full picture.
aws sqs get-queue-attributes \
  --queue-url https://sqs.us-east-1.amazonaws.com/123456789/your-queue \
  --attribute-names ApproximateNumberOfMessages ApproximateNumberOfMessagesNotVisible
Message age is not a standard CloudWatch metric.
ApproximateAgeOfOldestMessage exists as an SQS attribute, but it’s not automatically published to CloudWatch unless you create a custom metric. Many teams don’t have this set up, which means they’re alerting on depth alone. A queue with only 10 messages but a 6-hour age of oldest message is a serious problem. Depth tells you volume, not urgency.
CloudWatch alarms on depth alone miss slow-drain scenarios.
A slow drain is when messages are being consumed, but slower than they’re arriving. The depth stays low or grows gradually. An alarm with a depth threshold of 100 might never fire, while the queue is still accumulating a backlog. Slow drains are hard to catch without age-based alerting or rate-of-change metrics.
Message Replay: When to Do It and How Not to Make Things Worse
Replay is tempting. Messages in the DLQ feel like a problem you can fix by putting them back. Sometimes you can. But replay done wrong turns a containable incident into a much bigger one.
Never replay before the root cause is confirmed and resolved.
If the bug that caused the failures is still present, replay just refills the DLQ. If the downstream dependency is still down, replay creates a second wave of failures on top of the backlog. Replay is recovery, not diagnosis.
Replay a single message first as a canary.
Before bulk replay, move one message back to the source queue manually and watch it process. Check the consumer logs. Confirm the message succeeded end to end. This takes maybe three minutes and tells you whether bulk replay is safe.
# Move one message from DLQ to source queue manually
aws sqs change-message-visibility \
  --queue-url https://sqs.us-east-1.amazonaws.com/123456789/your-dlq \
  --receipt-handle <receipt-handle> \
  --visibility-timeout 0
Or use the SQS console’s “Start DLQ redrive” and set max messages to 1.
Check consumer idempotency before bulk replay.
If your consumer is not idempotent, replaying a message that was partially processed could cause duplicate database writes, duplicate charges, or duplicate notifications. Ask: what happens if this message gets processed twice? If the answer is “something bad,” fix that first or process messages manually with deduplication logic.
Replay in off-peak hours if message volume is large.
Replaying 10,000 messages into a source queue during peak traffic can spike your downstream services. If the DLQ is large, consider setting a maximum messages per minute on the redrive, or scheduling it for a low-traffic period.
Building a Runbook Your Team Will Actually Use
A runbook that lives in a 3,000-word Confluence document is not a runbook. It’s a novel no one reads at 2am.
Keep it short: one page, five steps, no paragraphs.
The format that works is a numbered list with one sentence per step. No background, no history, no explanations. Just: step 1, do this. Step 2, check that. Step 3, if you see X, go to section A. Save the explanations for a separate doc linked at the bottom.
Attach the runbook URL directly to the alert.
The runbook should be one click from the alert that woke you up. If it’s in Slack, include the URL in the alert message body. If it’s in PagerDuty, add it to the incident template. The engineer should never have to search for it.
Add queue-specific context.
A generic runbook is better than nothing, but a queue-specific one is much better. For your most important queues, note the consumer name, the downstream dependencies it calls, the typical message volume, and any known failure modes. This context cuts 5 to 10 minutes off every incident.
Review after every incident.
After each DLQ incident, add one line to the runbook: what the root cause was, and what the fix was. Over time, this builds a pattern library specific to your system. The next person who gets paged at 2am will have real examples to match against.
DeadQueue monitors SQS dead letter queues for depth, message age, and slow drains, then fires alerts to Slack, email, or PagerDuty with the queue name, depth, and a direct link to your runbook. The free tier covers 3 queues. Set it up in under 5 minutes at https://www.deadqueue.com.