Lambda Retry Storms: Why One Bad Message Fills Your DLQ
March 25, 2026 · DeadQueue Team
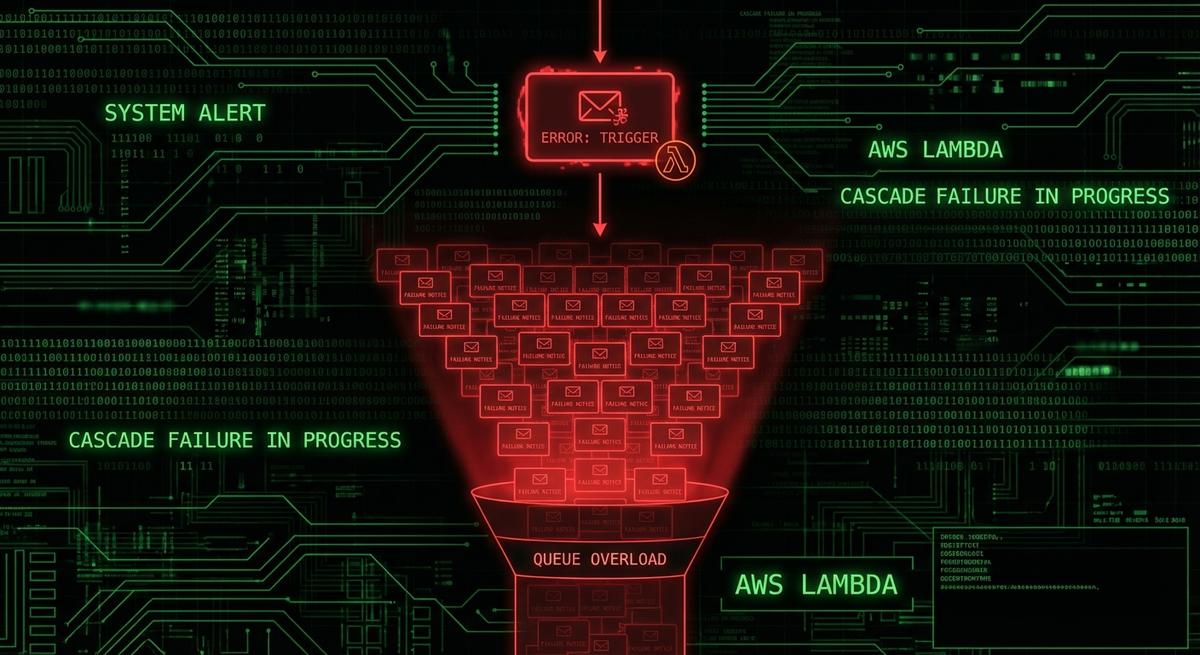
You get paged at 2am. Your DLQ has 847 messages. You assume mass failure, but your source queue is empty and your Lambda logs show only one distinct error. What you’re looking at isn’t a disaster. It’s one poison message that Lambda retried 847 times before giving up. The retry storm is over, but the damage to your on-call sanity is done.
This is more common than most teams realize, and the cause is almost always the same: misunderstood defaults that turn a single bad message into a flood of DLQ entries.
How Lambda Retries Work (And Why the Defaults Bite You)
When SQS triggers Lambda, the flow looks simple on the surface. Lambda polls the queue, grabs a batch of messages, and processes them. If something fails, SQS keeps the message invisible (via the visibility timeout) and tries again after the timeout expires. If the message fails enough times, it gets moved to the dead letter queue. That’s the expected behavior.
The part that trips people up is how those “enough times” stack.
The SQS maxReceiveCount setting controls how many times a message can be received before SQS routes it to the DLQ. The default for newly created queues is often left at whatever CloudFormation or the console defaults to, which can be anywhere from 3 to 10 or higher depending on how the queue was created. Teams set it once and forget it.
On top of that, Lambda has its own retry behavior. For async invocations, Lambda will retry a failed invocation twice before giving up. For SQS triggers (event source mapping), Lambda controls the polling loop itself, and a failed batch stays visible to SQS until the visibility timeout expires, at which point SQS makes it available for polling again.
Here’s where the multiplication happens. If your event source mapping has a batch size of 10 and maxReceiveCount is 10, you’re not looking at 10 retries of one message. You’re looking at the same message appearing in up to 10 different batches, each of which might contain 10 messages that get marked failed because the one bad message caused an unhandled exception. Every failure increments the receive count, and once that count hits the limit, the message goes to the DLQ.
But that’s just one failure path. If your Lambda function throws an unhandled error and the entire batch fails together, all messages in that batch get their receive counts incremented simultaneously. A single poison message can drag healthy messages down with it, sending them to the DLQ even though they had nothing wrong with them.
The visibility timeout matters here too. If your Lambda function has a 15-minute timeout and your SQS visibility timeout is set to 30 seconds (another common default), messages will become visible again before Lambda even finishes processing them. That means SQS will deliver the same message to a second concurrent Lambda invocation, doubling your retry count in real time.
The Retry Storm Scenario: One Message, Hundreds of DLQ Entries
The most common cause is a single malformed payload. A producer sends a message with invalid JSON, a missing required field, or a data type that doesn’t match what the Lambda handler expects. The handler throws an exception on the first line that tries to parse it. Every message in the batch fails. Every message gets its receive count incremented.
Let’s work through the math. Say maxReceiveCount is 10 and batch size is 10. The bad message enters the queue and gets picked up with 9 healthy messages. The handler throws on the bad message. All 10 fail. That’s one receive count increment for the bad message and one for each healthy message.
Repeat that 10 times. The bad message finally hits maxReceiveCount and goes to the DLQ. So do all 9 healthy messages that happened to share a batch with it, even if they only failed because of the exception propagation, not because of anything wrong with them.
Now add concurrency. If your queue is high-throughput and multiple Lambda instances are polling simultaneously, the same bad message can appear in overlapping polling windows. Before SQS knows to stop delivering it, three concurrent Lambda instances might each pick it up as part of three separate batches. Each batch fails. Three batches of 10 messages each, all getting their receive counts incremented at once.
In a busy queue, this can fill a DLQ in under two minutes. The alert fires, the on-call engineer logs in, and the DLQ shows hundreds of messages. The source queue is empty because processing continued normally for every other message. Lambda logs show a clean invocation history for everything except one error type. The incident looks like a mass failure but it’s a single bad actor that the retry mechanism amplified into noise.
The spike is fast enough that dashboards with 5-minute metric windows may not capture it clearly. By the time someone looks, the storm is over and the damage is done.
Why CloudWatch Doesn’t Catch This
The intuitive alarm to set is on DLQ depth: if ApproximateNumberOfMessagesVisible on the DLQ exceeds some threshold, alert. That’s what most teams do. It’s also why most teams don’t catch retry storms in time.
The problem starts with NumberOfMessagesSent. When SQS redrives a message to the DLQ after it exceeds maxReceiveCount, that operation does not increment NumberOfMessagesSent on the DLQ. The message appears in the DLQ, but the sent-message count metric stays flat. Any alarm built on message throughput will stay green.
The second problem is what the source queue looks like. When a retry storm is happening, the source queue often looks fine. ApproximateNumberOfMessagesVisible drops to zero because Lambda is polling aggressively and processing everything except the one bad message. From the source queue metrics perspective, this looks like success. Throughput is normal. Errors are invisible because they’re hidden in the DLQ.
The DLQ depth alarm is the obvious fix, but it usually fails in practice for two reasons. First, teams set the threshold too high. An alarm set to fire at 100 DLQ messages doesn’t help when a retry storm drops 500 messages in 90 seconds. By the time the alarm fires, the storm is already over. Second, CloudWatch metric resolution for SQS is 1 minute, and alarms often have evaluation periods of 5 minutes or more. You’re catching yesterday’s storm.
Message age is the signal most teams miss. ApproximateAgeOfOldestMessage on the DLQ tells you how long the oldest message has been sitting there. A retry storm that happened two hours ago and went undetected shows up clearly here. A new message arriving in a DLQ that was previously empty will register immediately. This metric is more sensitive than depth alone because it reflects recency, not just volume.
The right approach combines depth, rate-of-fill, and message age. None of those three signals alone is sufficient. Together, they cover the failure modes that individual alarms miss.
Diagnosing a Retry Storm After the Fact
You woke up to a full DLQ and you want to understand what happened. Here’s how to reconstruct it.
Start with the DLQ message bodies. If you’re looking at a retry storm from one bad message, the bodies won’t all be identical, but they’ll share patterns. Look for a MessageId prefix that repeats, or hash the message bodies and count duplicates. If you see one distinct body (or one malformed payload) repeated dozens or hundreds of times, that’s your culprit.
Next, check ApproximateAgeOfOldestMessage on the DLQ. This tells you when the storm started. If the oldest message is 3 hours old but the newest is 2 hours old, the storm was short and intense. If messages span 12 hours, you have a slow drain, not a storm. That distinction changes your response.
For the Lambda side, use CloudWatch Logs Insights. Filter your Lambda log group for error messages in the timeframe and group by the message content:
fields @timestamp, @message
| filter @message like /ERROR/
| stats count(*) by @message
| sort count desc
| limit 20
If one error message dominates by a factor of 10x, that’s your poison message’s stack trace. Cross-reference the timestamp of the first occurrence with when the DLQ started filling.
SQS message attributes give you more detail. ApproximateFirstReceiveTimestamp tells you when a given message was first delivered. ApproximateReceiveCount tells you how many times it was received. If you have a message in the DLQ with an ApproximateReceiveCount exactly equal to your maxReceiveCount, it hit the limit cleanly. If you see counts much lower, something else sent it to the DLQ early, or the queue configuration changed mid-storm.
One more thing to check: whether the DLQ has its own retention period set correctly. The default SQS retention is 4 days. If the storm happened more than 4 days ago and you’re investigating now, the messages may already be gone.
Preventing the Next Storm: Configuration Fixes That Actually Help
The first fix is maxReceiveCount. For most workloads, 3 to 5 is the right range. If your Lambda function is healthy and your payload is valid, it shouldn’t need more than a couple of attempts. A maxReceiveCount of 10 means a bad message gets 10 chances to corrupt your DLQ and drag healthy messages down with it. Cut that number down.
The second fix is batch item failure reporting. By default, if any message in a batch fails, Lambda reports the entire batch as failed and all messages get their receive counts incremented. With reportBatchItemFailures, your Lambda handler returns a partial success response, listing only the message IDs that actually failed:
def handler(event, context):
    failures = []
    for record in event['Records']:
        try:
            process(record)
        except Exception as e:
            failures.append({"itemIdentifier": record['messageId']})

    return {"batchItemFailures": failures}
This is the single most effective change you can make. The bad message gets its receive count incremented. The healthy messages in the same batch do not. You stop the cross-contamination that turns one bad message into hundreds of DLQ entries.
The third fix is the visibility timeout. Set it to at least 6 times your Lambda function’s configured timeout. If your function is set to 5 minutes, your visibility timeout should be at least 30 minutes. This ensures SQS doesn’t redeliver a message to a second Lambda instance while the first is still processing it. Concurrent delivery is one of the main mechanisms that amplifies retry storms in high-throughput queues.
The fourth is idempotency. Before any expensive operation (database write, external API call, payment processing), check whether you’ve already done this work for this message. Store a processed message ID in DynamoDB or Redis and skip duplicate processing. This doesn’t prevent DLQ fills directly, but it limits the damage when a retry storm causes the same valid message to be processed multiple times.
None of these are complicated. Most teams skip them because the default configuration “mostly works,” and it does, until one bad message hits at the wrong time.
Alerting on Rate-of-Fill, Not Just Depth
A DLQ that goes from 0 to 500 messages in 2 minutes is a retry storm. A DLQ that accumulates 5 messages per hour over a week is a slow drain from intermittent processing failures. These require completely different responses: one is a fire, the other is a maintenance item. A simple depth threshold alarm can’t tell them apart.
Rate-of-fill alerting tracks the delta in DLQ depth over time. If depth increases by more than X messages in Y minutes, that’s an anomaly worth paging for. The specific thresholds depend on your workload, but the shape of the alert is always delta-over-time rather than absolute count.
To implement this yourself in CloudWatch, you’d use a metric math expression comparing ApproximateNumberOfMessagesVisible at two different periods, then alarm on the difference. It works, but it requires more setup than a simple threshold alarm and can produce false positives if your baseline DLQ traffic is variable.
Message age at DLQ arrival complements rate-of-fill. If messages are arriving in the DLQ with an ApproximateAgeOfOldestMessage of less than 5 minutes, you caught a storm in progress and you have time to act. If that age is already 3 hours, the storm happened while you were asleep and you’re doing post-incident analysis, not incident response.
One thing most teams don’t account for: SQS retention. The default message retention period is 4 days. The maximum is 14 days. If your DLQ fills up and nobody notices for 5 days, those messages are gone. You can’t redrive them, can’t inspect them, can’t tell customers what happened to their orders or events. Unmonitored DLQs silently delete evidence of failures.
Rate-of-fill and message age together give you two things: early detection during a storm, and a clear timeline for post-incident investigation. Depth alone gives you neither.
Most teams don’t find out their DLQ filled until someone checks a dashboard the next morning. DeadQueue monitors your SQS dead letter queues for depth spikes, rate-of-fill anomalies, and message age, and alerts your team via Slack or email before messages expire. Free tier covers 3 queues. Takes about 5 minutes to connect. Try it at https://www.deadqueue.com.